11. Questions 11 through 21 are based on the following passage and supplementary material.
This passage is adapted from Jeffrey Mervis, “Why Null Results Rarely See the Light of Day.” ©2014 by American Association for the Advancement of Science.
The question of what to do with null results—when researchers fail to see an effect that should be detectable—has long been hotly debated among those conducting medical trials, where the results can have a big impact on lives and corporate bottom lines. More recently, the debate has spread to the social and behavioral sciences, which also have the potential to sway public and social policy. There were little hard data, however, on how often or why null results were squelched. “Yes, it’s true that null results are not as exciting,” political scientist Gary King of Harvard University says. “But I suspect another reason they are rarely published is that there are many, many ways to produce null results by messing up. So they are much harder to interpret.”
In a recent study, Stanford political economist Neil Malhotra and two of his graduate students examined every study since 2002 that was funded by a competitive grants program called TESS (Timesharing Experiments for the Social Sciences). TESS allows scientists to order up Internetbased surveys of a representative sample of U S adults to test a particular hypothesis (for example, whether voters tend to favor legislators who boast of bringing federal dollars to their districts over those who tout a focus on policy matters).
Malhotra’s team tracked down working papers from most of the experiments that weren’t published, and for the rest asked grantees what had happened to their results. In their emailed responses, some scientists cited deeper problems with a study or more pressing matters—but many also believed the journals just wouldn’t be interested. “The unfortunate reality of the publishing world [is] that null effects do not tell a clear story,” said one scientist. Said another, “Never published, definitely disappointed to not see any major effects.”
Their answers suggest to Malhotra that rescuing findings from the file drawer will require a shift in expectations. “What needs to change is the culture—the author’s belief about what will happen if the research is written up,” he says.
Not unexpectedly, the statistical strength of the findings made a huge difference in whether they were ever published. Overall, 42% of the experiments produced statistically significant results. Of those, 62% were ultimately published, compared with 21% of the null results. However, the Stanford team was surprised that researchers didn’t even write up 65% of the experiments that yielded a null finding.
Scientists not involved in the study praise its “clever” design. “It’s a very important paper” that “starts to put numbers on things we want to understand,” says economist Edward Miguel of the University of California, Berkeley.
He and others note that the bias against null studies can waste time and money when researchers devise new studies replicating strategies already found to be ineffective. Worse, if researchers publish significant results from similar experiments in the future, they could look stronger than they should because the earlier null studies are ignored. Even more troubling to Malhotra was the fact that two scientists whose initial studies “didn’t work out” went on to publish results based on a smaller sample. “The nonTESS version of the same study, in which we used a student sample, did yield fruit,” noted one investigator.
A registry for data generated by all experiments would address these problems, the authors argue. They say it should also include a “preanalysis” plan, that is, a detailed description of what the scientist hopes to achieve and how the data will be analyzed. Such plans would help deter researchers from tweaking their analyses after the data are collected in search of more publishable results.
Note: The following figure supplements this passage.
Adapted from Annie Franco, Neil Malhotra, and Gabor Simonovits, “Publication Bias in the Social Sciences: Unlocking the File Drawer.” ©2014 by American Association for the Advancement of Science.
Begin skippable figure description.
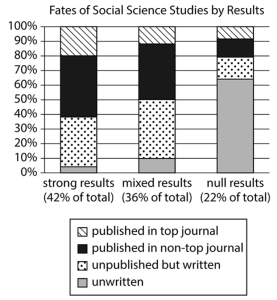
The figure presents a bar graph titled “Fates of Social Science Studies by Results.” On the horizontal axis, the following 3 categories are indicated, from left to right: “strong results, 42% of total”; “mixed results, 36% of total”; and “null results, 22% of total.” The bars representing each of the 3 categories are split into 4 sections with different patterns that represent 4 different conditions: “unwritten,” “unpublished but written,” “published in nontop journal,” and “published in top journal.” On the vertical axis, percent values from 0% through 100%, in increments of 10%, are indicated.
According to the graph, the approximate values for the bars, from left to right, are as follows.
Category “strong results, 42% of total.” Unwritten, 3%. Unpublished but written, 36%. Published in nontop journal, 41%. Published in top journal, 20%.
Category “mixed results, 36% of total.” Unwritten, 10%. Unpublished but written, 40%. Published in nontop journal, 38%. Published in top journal, 12%.
Category “null results, 22% of total.” Unwritten, 65%. Unpublished but written, 14%. Published in nontop journal, 12%. Published in top journal, 9%.
End skippable figure description.
Question 11.
The passage primarily serves to