1. Directions
For questions 1 through 30, solve each problem, choose the best answer from the choices provided, and fill in the corresponding circle on your answer sheet. For questions 31 through 38, solve the problem and enter your answer in the grid on the answer sheet.
Notes
1. The use of a calculator is permitted.
2. All variables and expressions used represent real numbers unless otherwise indicated.
3. Figures provided in this test are drawn to scale unless otherwise indicated.
4. All figures lie in a plane unless otherwise indicated.
5. Unless otherwise indicated, the domain of a given function f is the set of all real numbers x for which f (x) is a real number.
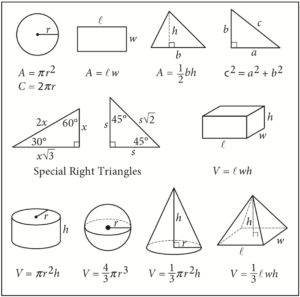
Reference
Begin skippable figure descriptions.
The figure presents information for your reference in solving some of the problems.
Reference figure 1 is a circle with radius r. Two equations are presented below reference figure 1.
A equals pi times the square of r.
C equals 2 pi r.
Reference figure 2 is a rectangle with length ℓ and width w. An equation is presented below reference figure 2.
A equals ℓ w.
Reference figure 3 is a triangle with base b and height h. An equation is presented below reference figure 3.
A equals onehalf b h.
Reference figure 4 is a right triangle. The two sides that form the right angle are labeled a and b, and the side opposite the right angle is labeled c. An equation is presented below reference figure 4.
c squared equals a squared plus b squared.
Special Right Triangles
Reference figure 5 is a right triangle with a 30degree angle and a 60degree angle. The side opposite the 30degree angle is labeled x. The side opposite the 60degree angle is labeled x times the square root of 3. The side opposite the right angle is labeled 2 x.
Reference figure 6 is a right triangle with two 45degree angles. Two sides are each labeled s. The side opposite the right angle is labeled s times the square root of 2.
Reference figure 7 is a rectangular solid whose base has length ℓ and width w and whose height is h. An equation is presented below reference figure 7.
V equals ℓ w h.
Reference figure 8 is a right circular cylinder whose base has radius r and whose height is h. An equation is presented below reference figure 8.
V equals pi times the square of r times h.
Reference figure 9 is a sphere with radius r. An equation is presented below reference figure 9.
V equals fourthirds pi times the cube of r.
Reference figure 10 is a cone whose base has radius r and whose height is h. An equation is presented below reference figure 10.
V equals onethird times pi times the square of r times h.
Reference figure 11 is an asymmetrical pyramid whose base has length ℓ and width w and whose height is h. An equation is presented below reference figure 11.
V equals onethird ℓ w h.
End skippable figure descriptions.
Additional Reference Information
The number of degrees of arc in a circle is 360.
The number of radians of arc in a circle is 2 pi.
The sum of the measures in degrees of the angles of a triangle is 180.
Question 1 refers to the following figure.
Begin skippable figure description.
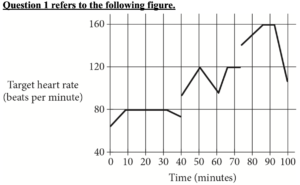
The figure presents a line graph in a coordinate plane. The horizontal axis is labeled “Time” in minutes, and the vertical axis is labeled “Target heart rate” in beats per minute. Numbers 0 through 100, in increments of 10, appear along the horizontal axis, and there are vertical gridlines at those numbers. Numbers 40 to 160, in increments of 40, appear along the vertical axis, and there are three horizontal gridlines at 80, 120, and 160. The line graph is divided into three disjointed pieces over three intervals: 0 to 40 minutes, 40 to 74 minutes, and 74 to 100 minutes.
Over the interval from 0 to 40 minutes, the line graph moves upward and to the right from 65 beats per minute at 0 minute, until reaching 80 beats at 9 minutes. It then moves horizontally, staying at 80 beats per minute until 32 minutes. The graph then moves downward and to the right, ending at 75 beats per minute at 40 minutes.
Over the interval from 40 to 74 minutes, the line graph moves upward and to the right from 95 beats per minute at 40 minutes, until reaching 120 beats per minute at 50 minutes. It then moves downward and to the right, until reaching 95 beats per minute at 62 minutes. The graph then moves upward and to the right, until reaching 120 beats per minute at 66 minutes. The graph then moves horizontally, ending at 120 beats at 74 minutes.
Over the interval from 74 to 100 minutes, the line graph moves upward and to the right from 140 beats per minute at 74 minutes, until reaching 160 beats per minute at 85 minutes. It then moves horizontally, staying at 160 beats per minute until 92 minutes. The graph then moves downward and to the right, ending at 110 beats per minute at 100 minutes.
End skippable figure description.
Question 1.
John runs at different speeds as part of his training program. The graph shows his target heart rate at different times during his workout. On which interval is the target heart rate strictly increasing then strictly decreasing?